
Building a Better JavaScript Profiler with WebKit
By Francisco Tolmasky on
I had the pleasure of showing off some the cool new features we’ve been adding to the WebKit inspector at JSConf last week. It’s no secret that debugging basically sucks in JavaScript, and until recently, it was a little bit worse in Objective-J. Up until now we’ve focused mainly on adding stop gap measures to our own code, but recently we’ve decided to shift gears and attack the problem head on in the browsers themselves. This is why these past couple of weeks I’ve set aside the JavaScript code and instead focused on working with the great guys on the WebKit team on providing a solid debugging experience both in Objective-J and JavaScript in general. We first decided to focus on profiling, since this is an area of considerable interest for a framework. All the code I’ve committed is now available in the latest WebKit nightly, so if you want you can download it to follow along. I’ve also added to the end of this post links to both the WebKit commits we added, as well as the accompanying code we put in Cappuccino in an effort to show how to make the best use of these new features and encourage others to take a stab at adding some debugging features to WebKit. Surprisingly enough, the folks over at Joose wasted no time incorporating this into their own library, so I’ve included links to their additions as well.
Anonymous and Poorly Named Functions
Had you run a Cappuccino application through Firebug’s profiler back in September when we originally open sourced the framework, you would have probably seen something that looked like this:
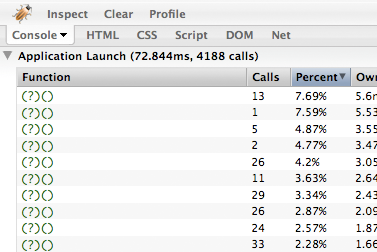
Anyone who’s done a significant amount of profiling with Firebug has probably run into the dreaded question mark functions at some point or another, but as you can see from above, it used to be particularly egregious in Objective-J. The reason these question marks show up is because somewhere the script in question contains an anonymous function. Anonymous functions, or lambdas as they’re sometimes referred to, are functions that you can declare just about anywhere in your program and not bother naming. Take the following code for example:
Here we’re using an anonymous function to perform special behavior on a mouse click event, and when profiled, this function will show up as a question mark. The obvious workaround is to simply declare this function normally somewhere else in the code, but this isn’t always possible because you might need it inline in the code so as to form a closure. So instead the recommended solution today is to simply give it a name with the following syntax:
And in this particular case, this will work quite well and allow this function to appear in profile as clicked. However, there are certain cases where this won’t work. Let’s look at a different snippet of code to see such a case:
Here we’ve created a function called generator that creates other functions when executed. As is, these functions will show up as question marks just as before, but this time we can’t simply name them inline because then all the generated functions would show up with the exact same name:
Unfortunately, there is really very little we can do to remedy this situation short of using an eval statement, which would change the performance characteristics of this method so drastically that the entire exercise would become moot. It’s not just floating anonymous functions that suffer from poor naming though. Imagine that you have created the following prototypal classes and methods in your application or library:
Both in Firebug and Safari, this code will generate a largely useless profile:
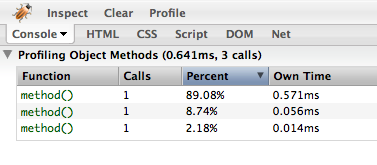
This profile is almost as ambiguous as when it was all question marks. We can’t tell whether MyClass.myMethod, MyClass.prototype.myMethod, or MyOtherClass.prototype.myMethod is the bottleneck here. If we aren’t generating these methods in any special way, we could try to name them inline, but we’d have to mangle the names considerably to pack in all the information we need:
This is clearly not the most elegant solution, and doesn’t scale given the fact that you have limited visual room in Firebug and Safari (you actually can’t stretch the function name column in either profiler). This also runs the risk, albeit a small one, of clashing with an existing function name. But the important thing to notice here is that it is not necessarily anonymous functions that are the source of the problem, but the fact that functions don’t actually have real names in JavaScript. It is only the variables that are bound to them that are named. So in order to solve this issue once and for all, we decided to define a way to explicitly give functions a name for debugging: the displayName attribute. In WebKit, you can now simply set this property with any arbitrary name you desire. Let’s revisit our generator example from earlier and see what we can do with this slightly modified code:
If we now rerun this profile in a recent WebKit nightly, we should see something like this:
Each function is now clearly identifiable in the results, allowing us to actually make use of this data. We can extend this same approach to our prototypal classes we defined above to achieve a similar effect:
If we were to profile this now, the much more descriptive displayNames would show up instead of simply seeing method() used in every case. This is the basic idea behind what Objective-J does in the latest Cappuccino 0.7 betas, but it takes place completely automatically behind the scenes, so that with no code changes of your own, applications now look something like this when profiled:
As you can see from this profile, Objective-J now has first class profiling support in WebKit. The best part about this though is that it’s not just limited to Objective-J: any language abstraction now has the opportunity to make the same use of these tools. Objective-J happens to be a great candidate because it is such a thin wrapper around JavaScript, but a project such as processing.js could show the actual processing functions instead of their generated JavaScript analogues, or perhaps GWT could have a flag where it shows the Java methods in the profiler instead of the generated JavaScript as well. We’ve actually taken this one step further in Objective-J though, and used this feature to display information that you actually can’t presently see with normal JavaScript scripts. Currently both Safari and Firebug are incapable of profiling code that doesn’t execute explicitly in a function. This means that if a good portion of your profile is taking place at the top level of a script file, it will be completely left out in Firebug and lumped into the overly generic (program) category in Safari. But thanks to the special way we handle files in Objective-J, we are able to tell our users precisely how much time they are spending in a specific file:
This is actually what I found most exciting about this seemingly simple property addition. In less than a day I was able to apply it in a completely new way to supply WebKit with even more information than we had originally designed it for. I feel that there is something really interesting in the idea that the code can interact directly with the debugging tools, and its why I believe that despite the debugging situation being so poor in JavaScript today, it has the potential of being much better than that of traditional languages. Expect to see us experiment more with this new kind of debugging here at 280 North in the future, because this is clearly just the tip of the iceberg.
More Fine-Grained Profiling
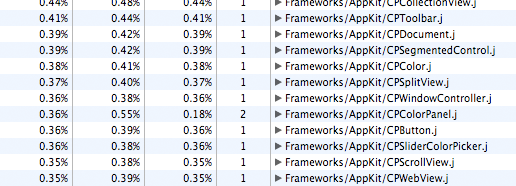
The other thing we focused heavily on doing these last couple of weeks was completely rewriting the Bottom Up View of the WebKit profiler. To get a better idea of what this is, lets first take look at the other alternative WebKit currently gives you for analyzing your profiles, known as the Top Down View:
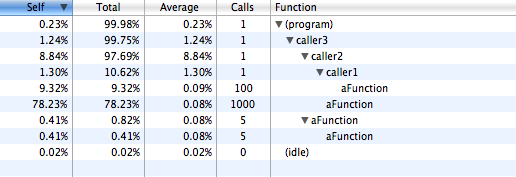
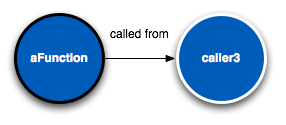
The Top Down View shows you a graph of the actual flow of your application, a call stack with the very first functions that were executed as the root nodes and the functions they called as their children. Thus, the data in each row represents the statistics for the call stack starting with the root node, and ending in the child node. I’ve fully expanded all the nodes here to be able to see the entire call graph. If we look at the second to last line of this view, we can see that it represents a recursive call to aFunction that took place from within a call to caller3:
We’d read this by saying that 0.41% of the time was spent in 5 calls to aFunction with this call stack. While this representation of your profile certainly gives you a very holistic view of what happened in your program and can help you get a better idea of the general flow of functions taking place, it’s harder to draw conclusions such as which function most of the time is being spent in. To do this, we would need to add up all the individual child times and then compare them to eachother. In this simple example this doesn’t seem that daunting, but you can imagine that it can quickly become quite complex.
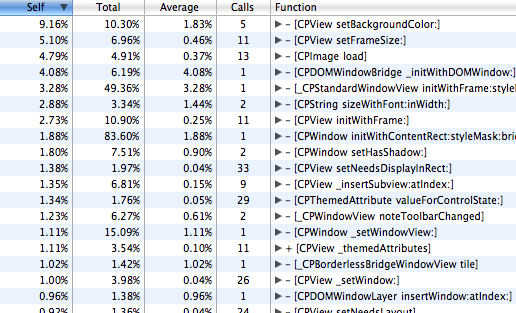
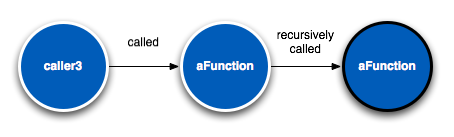
This is where the Bottom Up View comes in. Let’s take a look at the same profile using this view:
If we leave the children collapsed, this should look very familiar to Firebug users: it is a flat list of every function called in your program, and how much time was spent in each. However, where things really get interesting is when you expand the children:
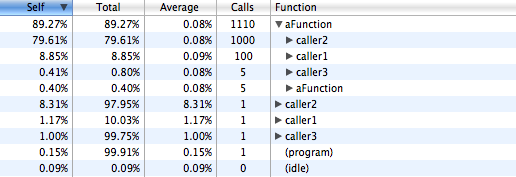
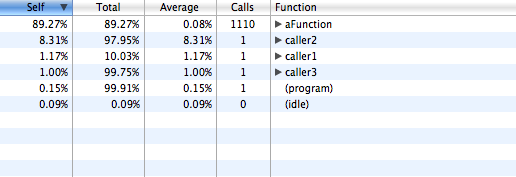
Unlike in the Top Down View, the children here represent the parents, or callers, of the root function in question. For example, the second row represents the call stack starting at caller3 and ending at aFunction:
Because of this, the statistics on each row actually still refer to the original root node, and not the child as in the Top Down View. So on the second row you’d say “1000 calls to aFunction took place originating from caller3”. Essentially we are just flipping the Top Down View on its head. In order to understand why this information is so powerful, let’s take a look at a real world example I recently ran into in Cappuccino. Now, the following is an Objective-J profile, but the principles are exactly the same in normal JavaScript:
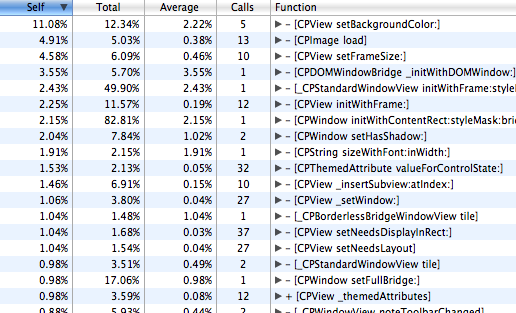
If we were using Firebug or any other flat listing tool, the naive interpretation of this profile would be that setFrameSize: is probably something worth tuning since it is third on our list and takes about 4.58% of our profile’s total time. This diagnosis is not wrong in the strict sense, but we may find it difficult to find out exactly why this method is so slow if we simply jump into setFrameSize:’s implementation and start hacking away. Remember that functions can be quite complex internally as well, and you may spend your time needlessly optimizing a code path in this method that was not even reached during the profile. However, we may get a better idea if we instead inspect this further and look at setFrameSize:’s callers:
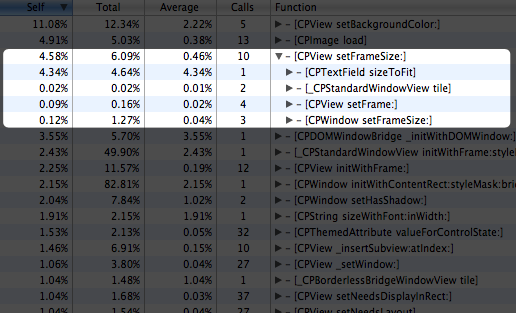
Interestingly enough, after expanding this node we find that it is not necessarily setFrameSize: which is universally slow, but rather some special interaction between setFrameSize: and its caller sizeToFit. We know this because this method usually takes an average of 0.01% to 0.04%, but specifically when called from sizeToFit it takes a whopping 4.34%, over 200 times as long. Not only that, but all this time is concentrated in just 1 actual call, profiling gold! Perhaps there is something in sizeToFit that is purging a cache that setFrameSize: relies on, or perhaps sizeToFit causes setFrameSize: to take a completely different code path internally than normal. It could be any number of reasons, but we are now empowered with a much better understanding of what exactly is happening in the program that is causing this slowdown. In other words, this allows us to profile not only the functions themselves, but the relationship between functions as well.
What’s Next?
Debugging in JavaScript still has a long way to go. These changes are like night and day for frameworks like Cappuccino, but we have a bunch of other ideas we’d like to get implemented in WebKit’s inspector as well. We also think its important to try to take some of the work we’ve done here and get it placed into Firebug. Given that there is no one browser your code will run in, it is important to have a great set of tools on as many browsers as possible. We’ve used a hacked version of Firebug internally before, and if I recall correctly it shouldn’t be too difficult to add support for the displayName property to function objects, so hopefully we’ll get a patch out for that soon.
Addendum
As promised earlier, I have included a list of links to the WebKit, Cappuccino, and Joose commits below. The Cappuccino and Joose commits should help you integrate support for these new WebKit features in your own application or library, and hopefully the WebKit commits will inspire you to report/fix/write new features for JavaScript debugging: